Order one of our free resource packs today! Fill out the form here.
Data - the Engine under the Bonnet
In this blog Hep C U Later Data Analyst Rob Fair tells the story of how data transformed the team’s ability to meet people’s healthcare needs, improve pathways and reach hepatitis C micro-elimination within community drug and alcohol services.
As we come towards the end of the initial phase of the project it is a time to reflect on what a fantastic journey it has been to move towards hepatitis C micro-elimination in community drug and alcohol services.
We have called this blog ‘Data – the engine under the bonnet’, and over the period of the Hep C U Later programme, the data, and more importantly its use has changed. Initially it was seen as a method of managing project performance with the setting of measurable key performance indicators (KPI’s), it was never envisaged as a method of providing information directly that could be used in supporting the individual treatment of people at risk of hepatitis C. It was only through discussions within the Hep C U Later team and the wider ‘data users’ within the NHS Addiction Provider Alliance (NHSAPA) that this ‘game changer’ was first suggested and then implemented.
So let’s start at the beginning, I am Rob and I started with Hep C U later as their data analyst under the tutelage of David Cupit (Commercial Lead, Inclusion) in February 2020, a mere 6 weeks before the Covid-19 pandemic hit. Some work had been done on data with the setting out of a number of agreed ‘project measurable’ metrics these being the following.
-
Number of all people registered and active within the service
-
Number of all active people who currently or have previously injected
-
Number of people tested in the last 30 days
-
Number of people tested in the last 12 months
-
Number of people tested in the last 5 years
-
Number of people with a current RNA positive result
-
Number of people referred to treatment within the last 30 days
-
Number of people referred to treatment within the last 12 months
-
Number of people referred to treatment in the last 5 years
The first question was where do we get the data from? The preliminary work during planning phase had been to ask the members of the NHSAPA (multiple NHS Trusts) to provide data required for the metrics on a monthly basis. Having worked in the community drug and alcohol sector before I suggested that we use our common dataset that all the members used in the form of the National Drug Treatment Monitoring Service (NDTMS).
This immediately led to the issue of data sharing. We were going from asking for ‘figures’ to anonymised person centred data. This led to all members having to consider issues around data sharing, data processing, the setting up of data sharing agreements (eg MOUs), and in some cases full data sharing agreements covered by DPIAs and Caldicott. I cannot praise highly enough, the members of the NHSAPA who all came through. They saw the importance of sharing their data and their collective passion and collaborative approach to eliminate hepatitis C shone through. So, we waited for the first data to arrive, and produced our first dashboard.
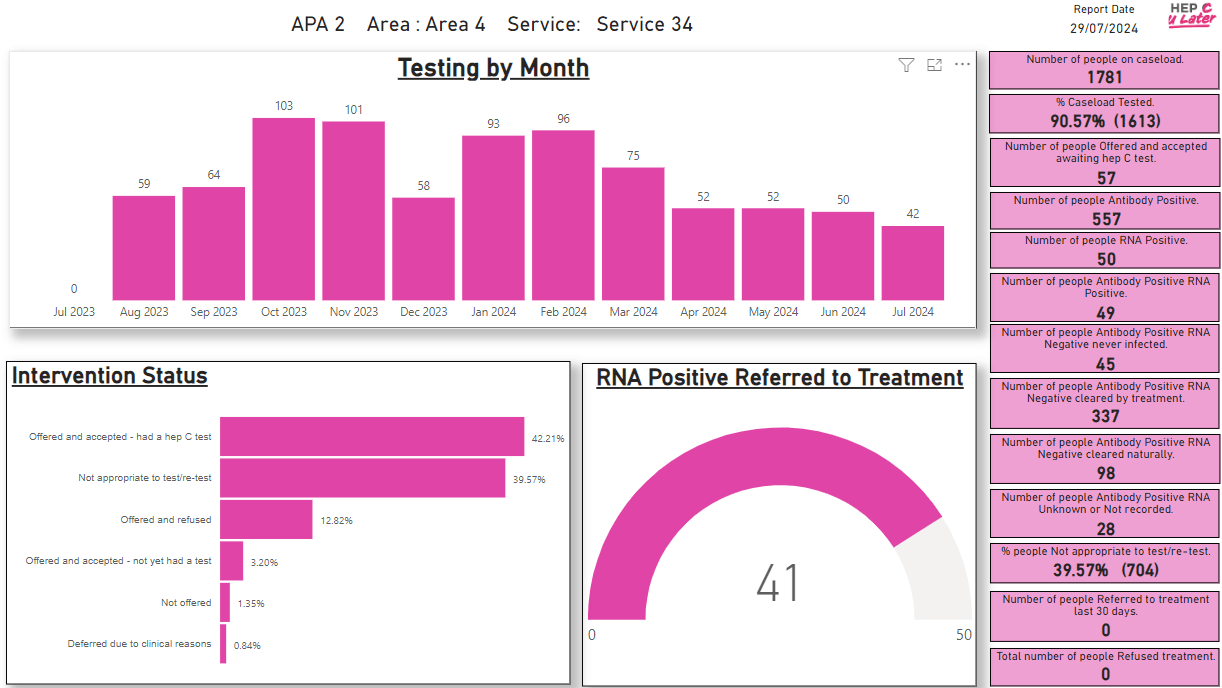
Our first dashboard answered the data questions we had been asked at the start of the project. The dashboard developed over time and the data was presented in different ways, using graphs and bar charts to demonstrate how many people were tested each month.
The game changing light bulb moment was when one of the team asked a simple question – ‘Do we know who the individual people tested in the last 30 days are?’. The answer was YES and NO. Yes we had their NDTMS number, and no we did not know their names. However from the NDTMS number the individual NHSAPA members using their case management systems would be able to identify ‘Sally Smith’ from the NDTMS identifier. From this point on the data took on a whole new and more productive life. It had gone from ‘How Many’ to “Sally Smith needs a hep C test”. The use of the data to support not only the NHSAPA members to achieve hepatitis C micro-elimination, but most importantly ‘Sally’ to become hepatitis C free is at the core of the project. The critical way in which data is used is not to count, or manage performance, but to ensure that data used to identify, test and treat has a positive impact on a person’s life.
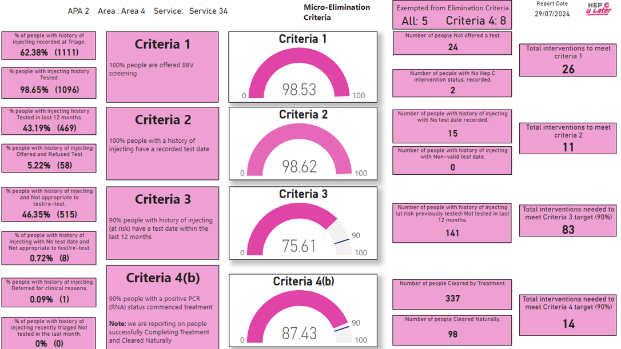
As the hepatitis C micro-elimination criteria was agreed by the members of the Drug Treatment Provider Forum* the dashboard evolved to incorporate this, providing community drug and alcohol services with a tough benchmark to reach. Although the work of testing and supporting people to access treatment doesn’t stop once a service reaches micro-elimination the NHSAPA have now reached this milestone in 22 drug and alcohol services.
So, as we continue to reach micro-elimination across NHSAPA services the use and effectiveness of the data has allowed Hep C U Later to support the NHSAPA, the drug and alcohol services, and most importantly of all, the people accessing those services to become free of hepatitis C.
We currently have a dashboard. This dashboard gives a snapshot of where NHSAPA members and their individual services are on the journey to hepatitis C micro-elimination.


Image: An anonymised version of the current Hep C U Later dashboard.
Hep C U Later also provide what we refer to as ‘magic data’. This is the information provided to individual NHSAPA members that outlines the suggested actions required for each individual accessing those services based on their NDTMS statuses. For example, it will list each individual identifier, which criteria it refers to, and a suggestion such as ‘test required’ or ‘review person for risk of hep C…’.
Over the last 4 years of the project the way we have processed and provided data has changed and is always improving. All of these changes, and the changes to come, have been driven by the individual NHSAPA members, the individuals who use the data, and those people who are affected by the data by listening to feedback. We will soon be adding an anomaly report, enabling services to improve upon data quality even further.
I want to say a big thank you to all of the people who send us the data, the team here at Hep C U later, Chris Heaps (my data analyst colleague) for validating and checking the data, and to David Cupit for giving me the opportunity to get involved in this fantastic project.